Interactive demo
Excel dashboards
A dashboard that responds to a click.
Interactive sales dashboard on this page
Personal project: spreadsheet structure, formulas, charts and an interactive web version
The data is fictitious and shows the kind of deliverable. It does not represent a company or a client's results.
THE DECISION THAT MATTERS
No macros and no pivot tables to refresh
Every indicator starts from a table of entries and is calculated with formulas. Changing the month or editing an entry updates the whole dashboard, and the file opens in any Excel without asking to enable content.
TRY THE SALES DASHBOARD
Pick a month, a region or a salesperson.
The indicators, charts and ranking are recalculated with every choice, just like in the spreadsheet. Click a month in the chart or a salesperson in the ranking to filter.
Monthly revenue vs. target
Bars: actual. Dash: monthly target.
Salesperson ranking
Revenue and share of the individual target.
Revenue by category
Share in the filtered period.
Best-selling products
The five products with the highest revenue in the filtered period.
| Product | Units | Revenue | Share |
|---|
Enable JavaScript to use the dashboard. Images of the spreadsheets are available below.
Fictitious data: 310 orders from January to June 2026, the same as in the spreadsheet. The dashboard is calculated in your browser and sends no data.
Download the sales dashboard spreadsheetThe challenge
Many small businesses already record sales, expenses and inventory in spreadsheets but have no place to read those numbers. The question of the month, whether the target was hit and what changed from the previous month, ends up answered with calculations by hand.
What I built
Four Excel dashboards, each with a table of entries, a parameters tab, such as targets and budget, and a reading screen. The sales and finance dashboards have a month selector; the inventory and short-term rental ones update when the data is edited.
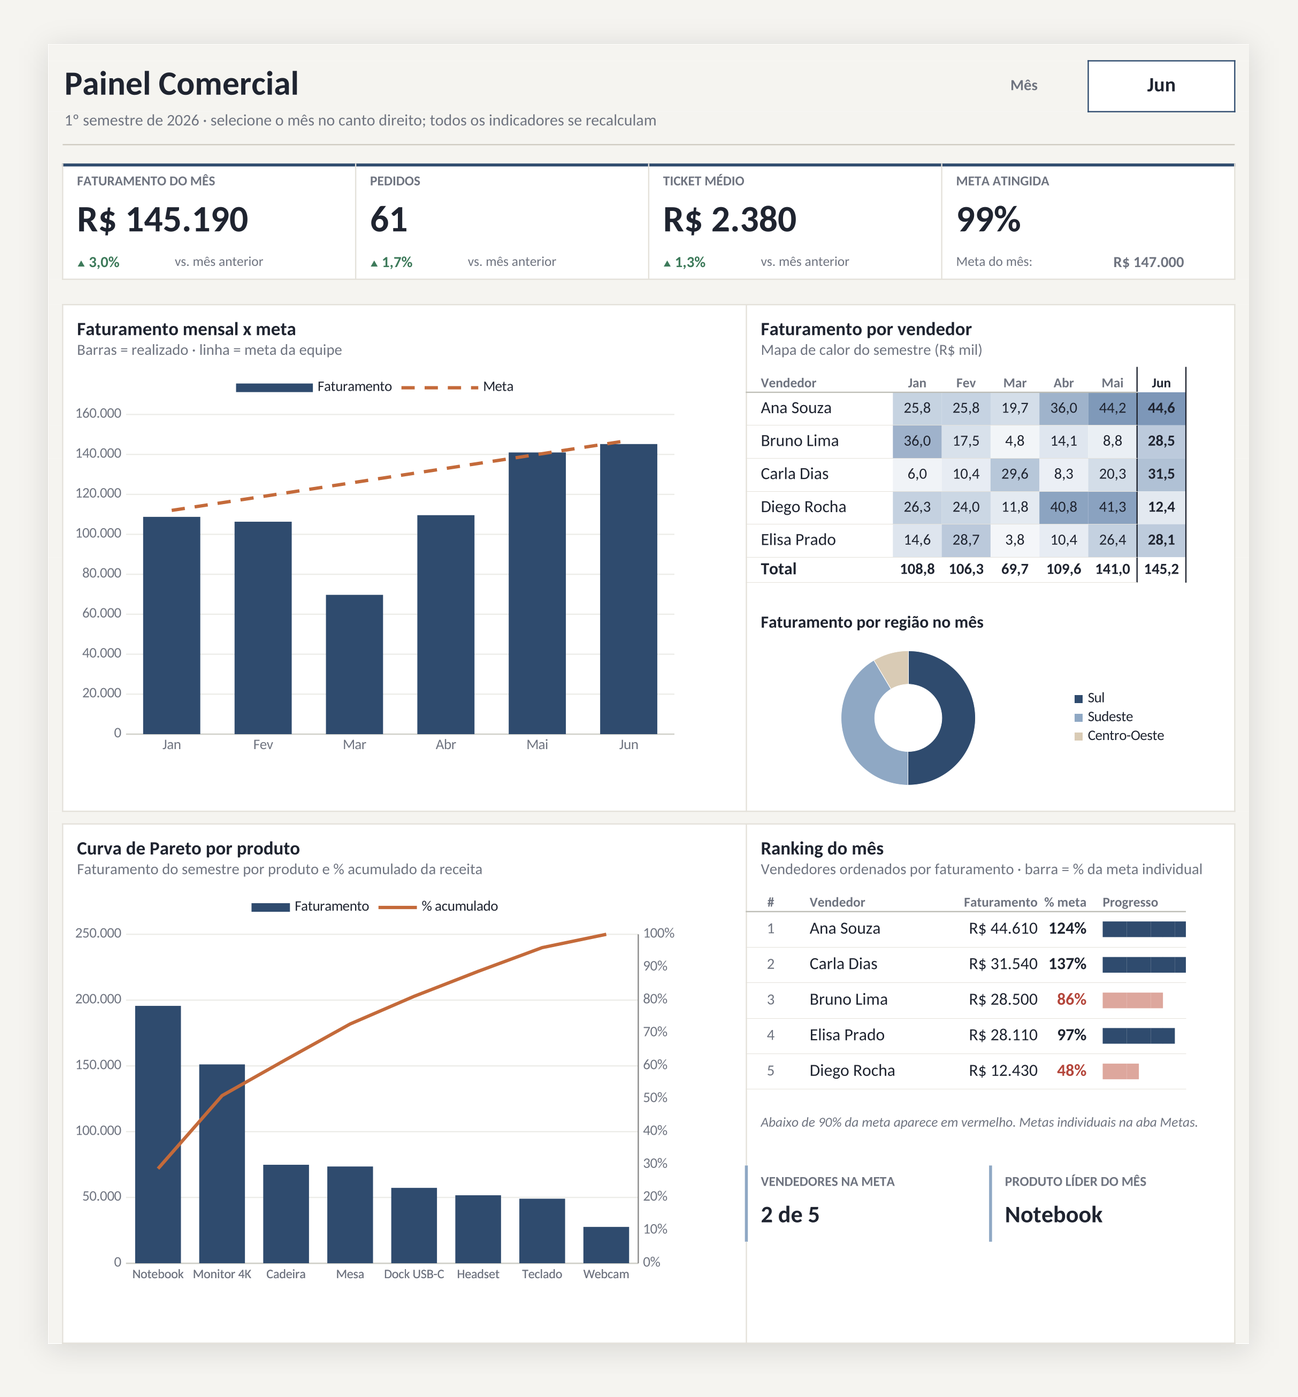
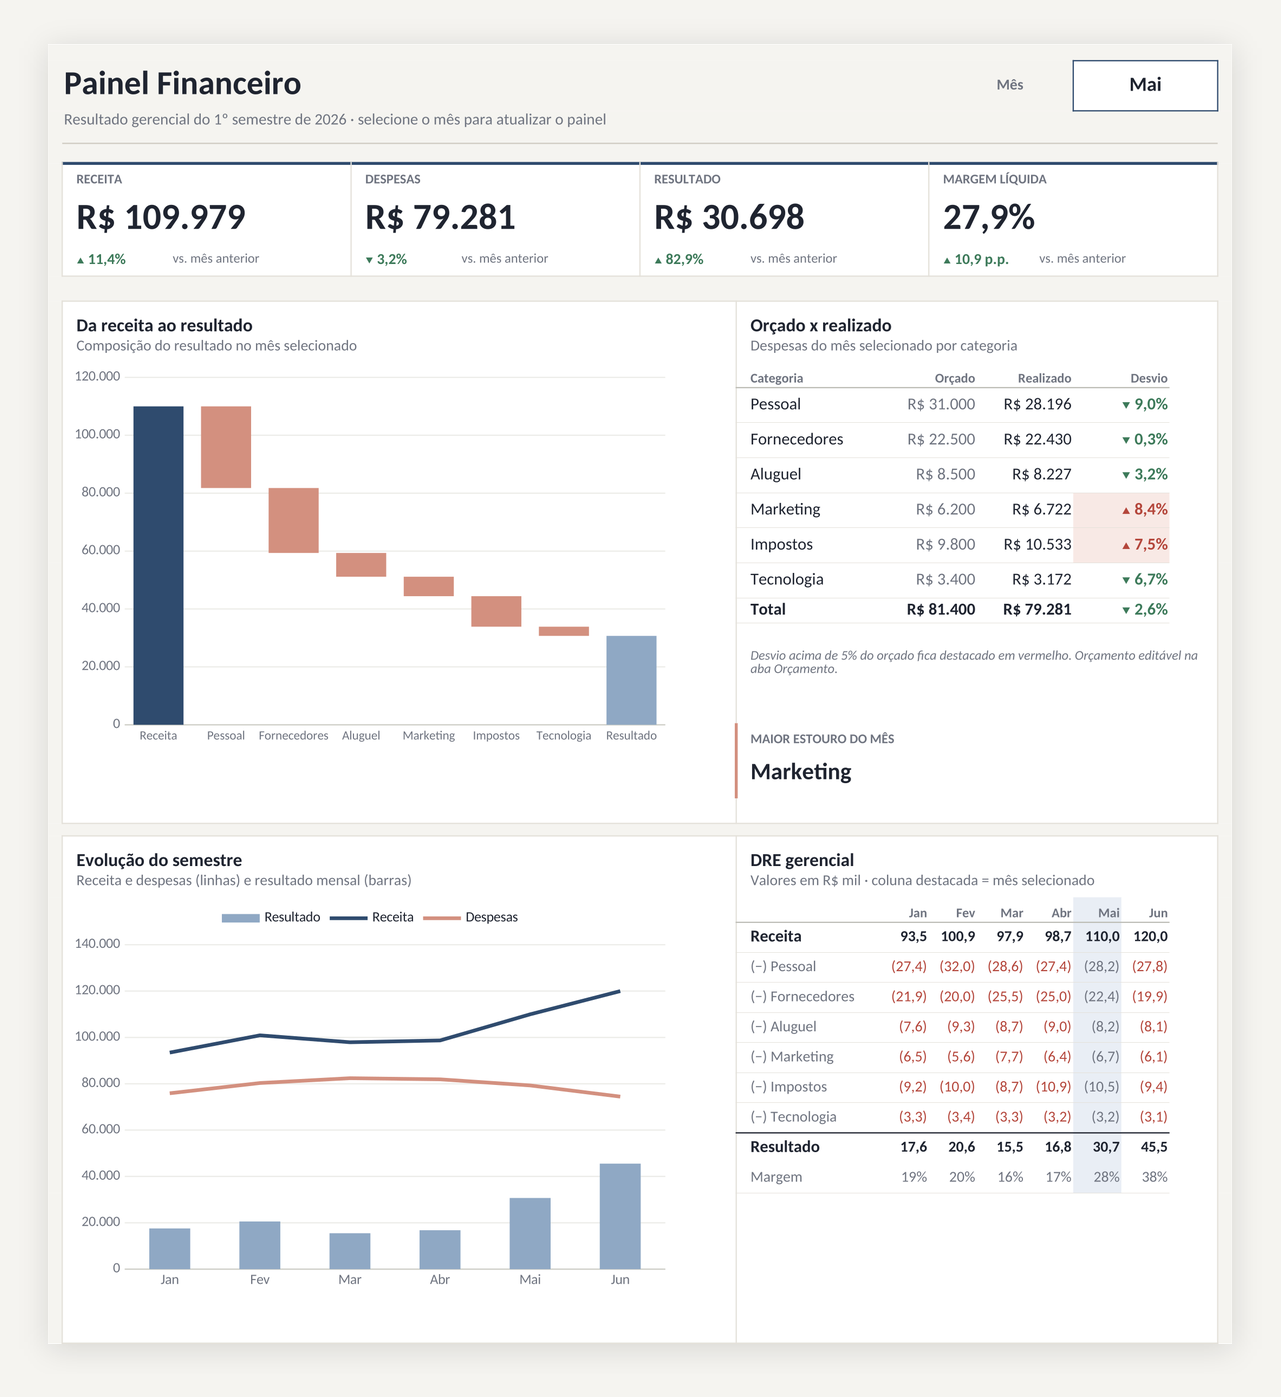
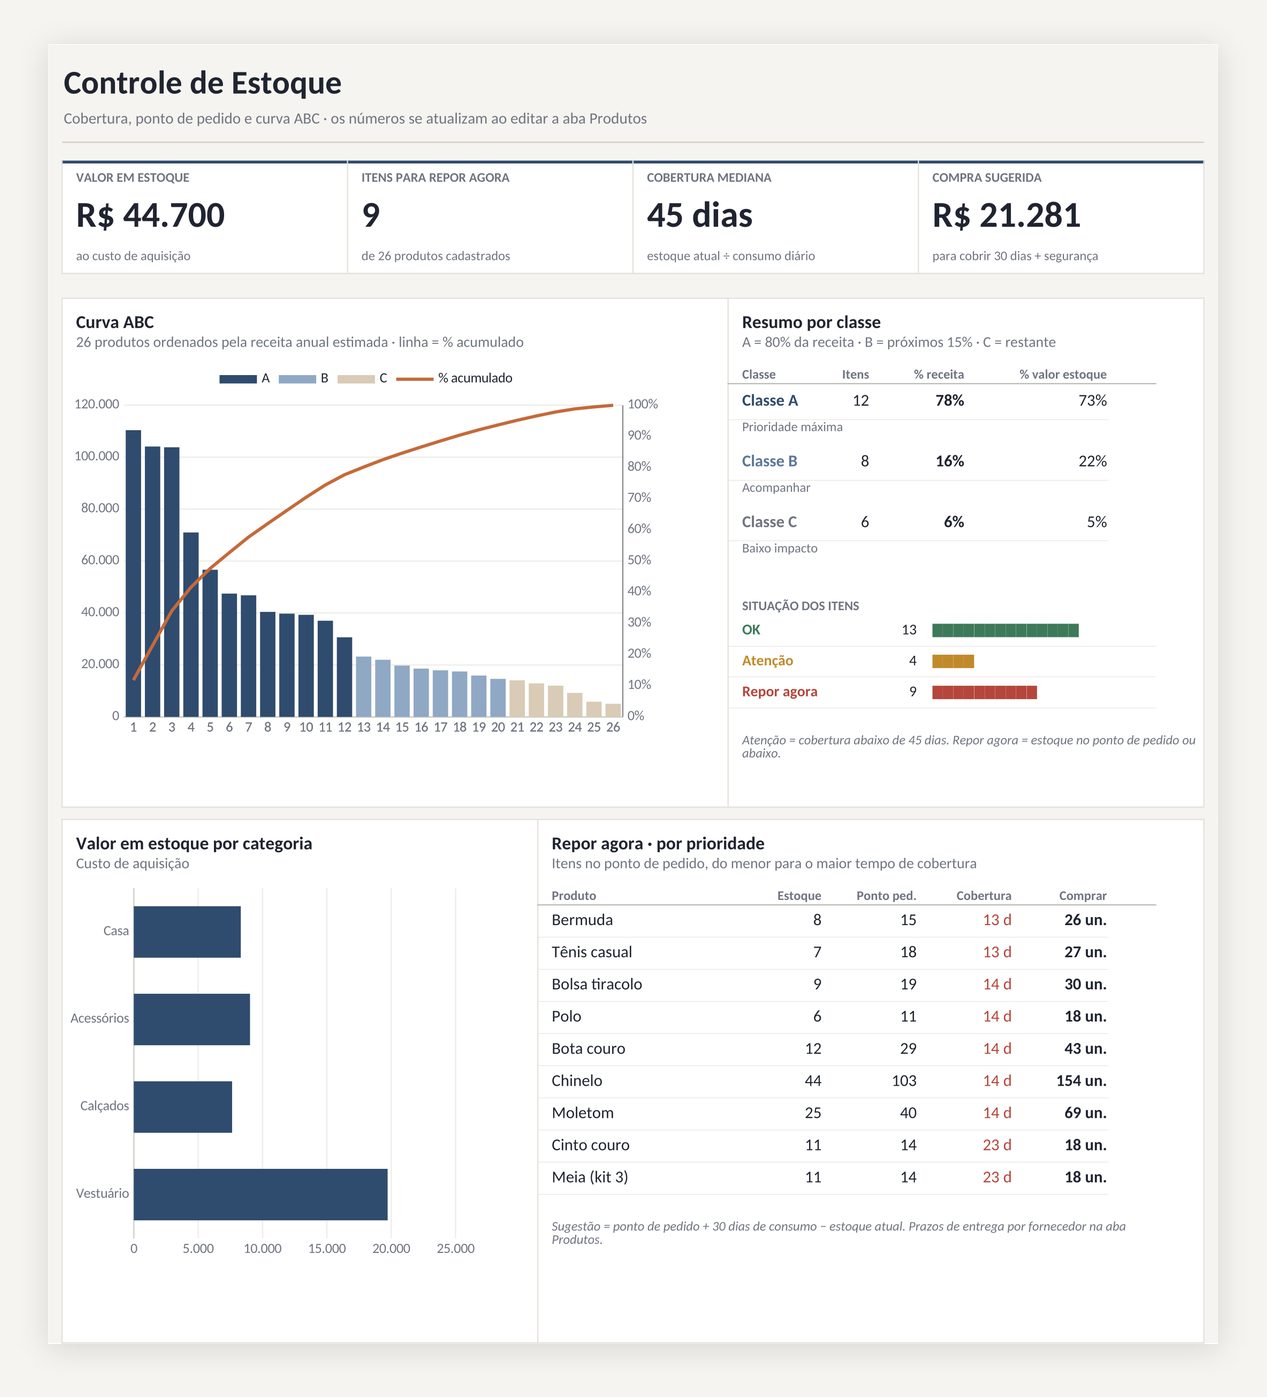
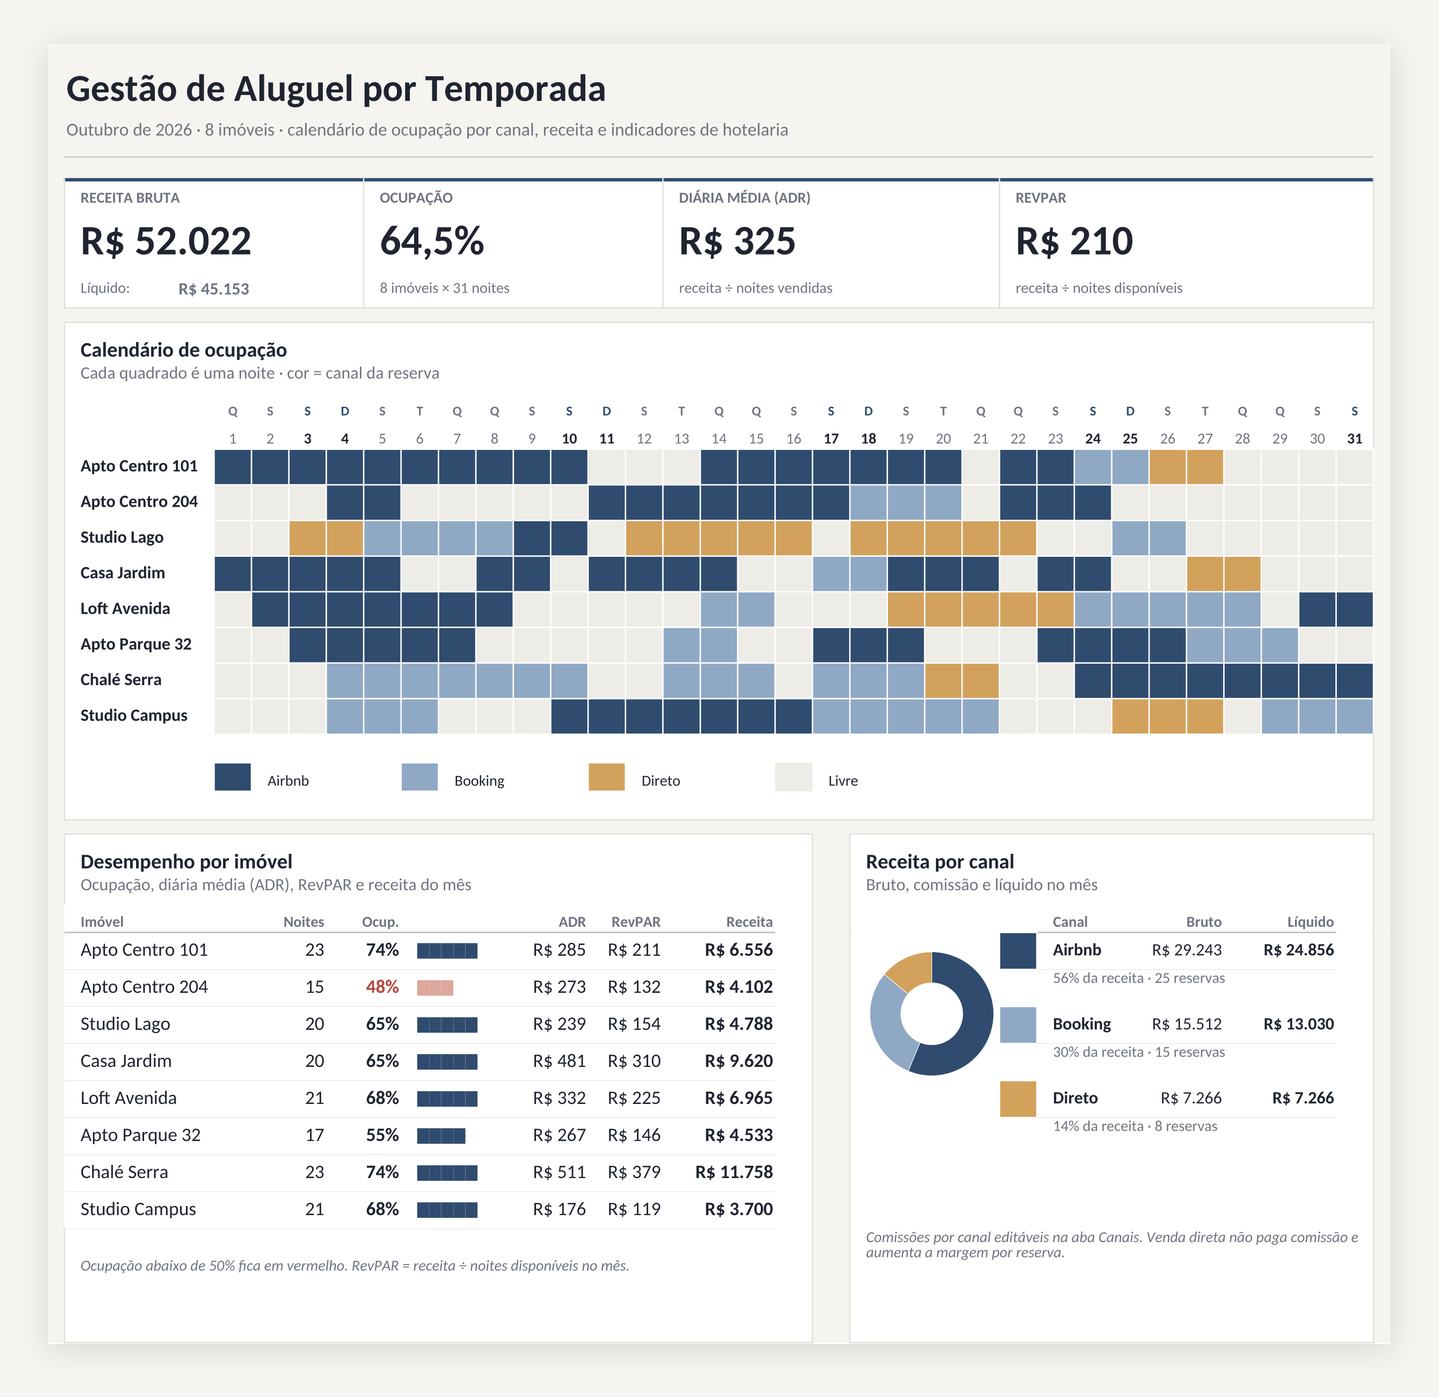
Companies, people and amounts are fictitious.
The result
A screen that shows the month, compares it with the previous one and highlights what needs attention, such as a salesperson below target, an expense over budget or an item at its reorder point. The sales dashboard is available for download and can be explored above, in the interactive version.
Explore the technical details
SUMIFS, COUNTIFS, INDEX and MATCH formulas; data validation for the month selector; conditional formatting for the heat map and alerts; native Excel charts. The version on this page was written in JavaScript, without libraries, and calculates the indicators from the same orders as the spreadsheet.