All projects

BI in production

Alugaix BI dashboards

The numbers of 60 properties on three screens.

Used in the monthly close with property owners

MY ROLE

Co-founder, responsible for data: integration, metrics and dashboards

HOW TO READ THE RESULT

Real screenshots of the internal systems, with values, names and recommendations blurred to protect clients.

THE DECISION THAT MATTERS

Show the number together with how to read it

Each metric is compared with the previous period and comes with an explanation of how to read it. People outside data understand what changed without opening a spreadsheet.

The challenge

Operational data was spread across the booking system (Hostify), the pricing tool (PriceLabs) and the sales channels. Each audience needed a different view: the team follows the day, management follows the month and owners follow their own properties.

My contribution

I integrated the sources via API, standardized the data and defined the metrics: occupancy, average daily rate, RevPAR, bookings, channels, reviews, cleaning and payouts. From them, I built one dashboard for each audience.

The dashboards

The metrics reach three audiences: the team follows operations on an office screen, management reviews performance in the executive dashboard, and each owner tracks their own properties in a portal.
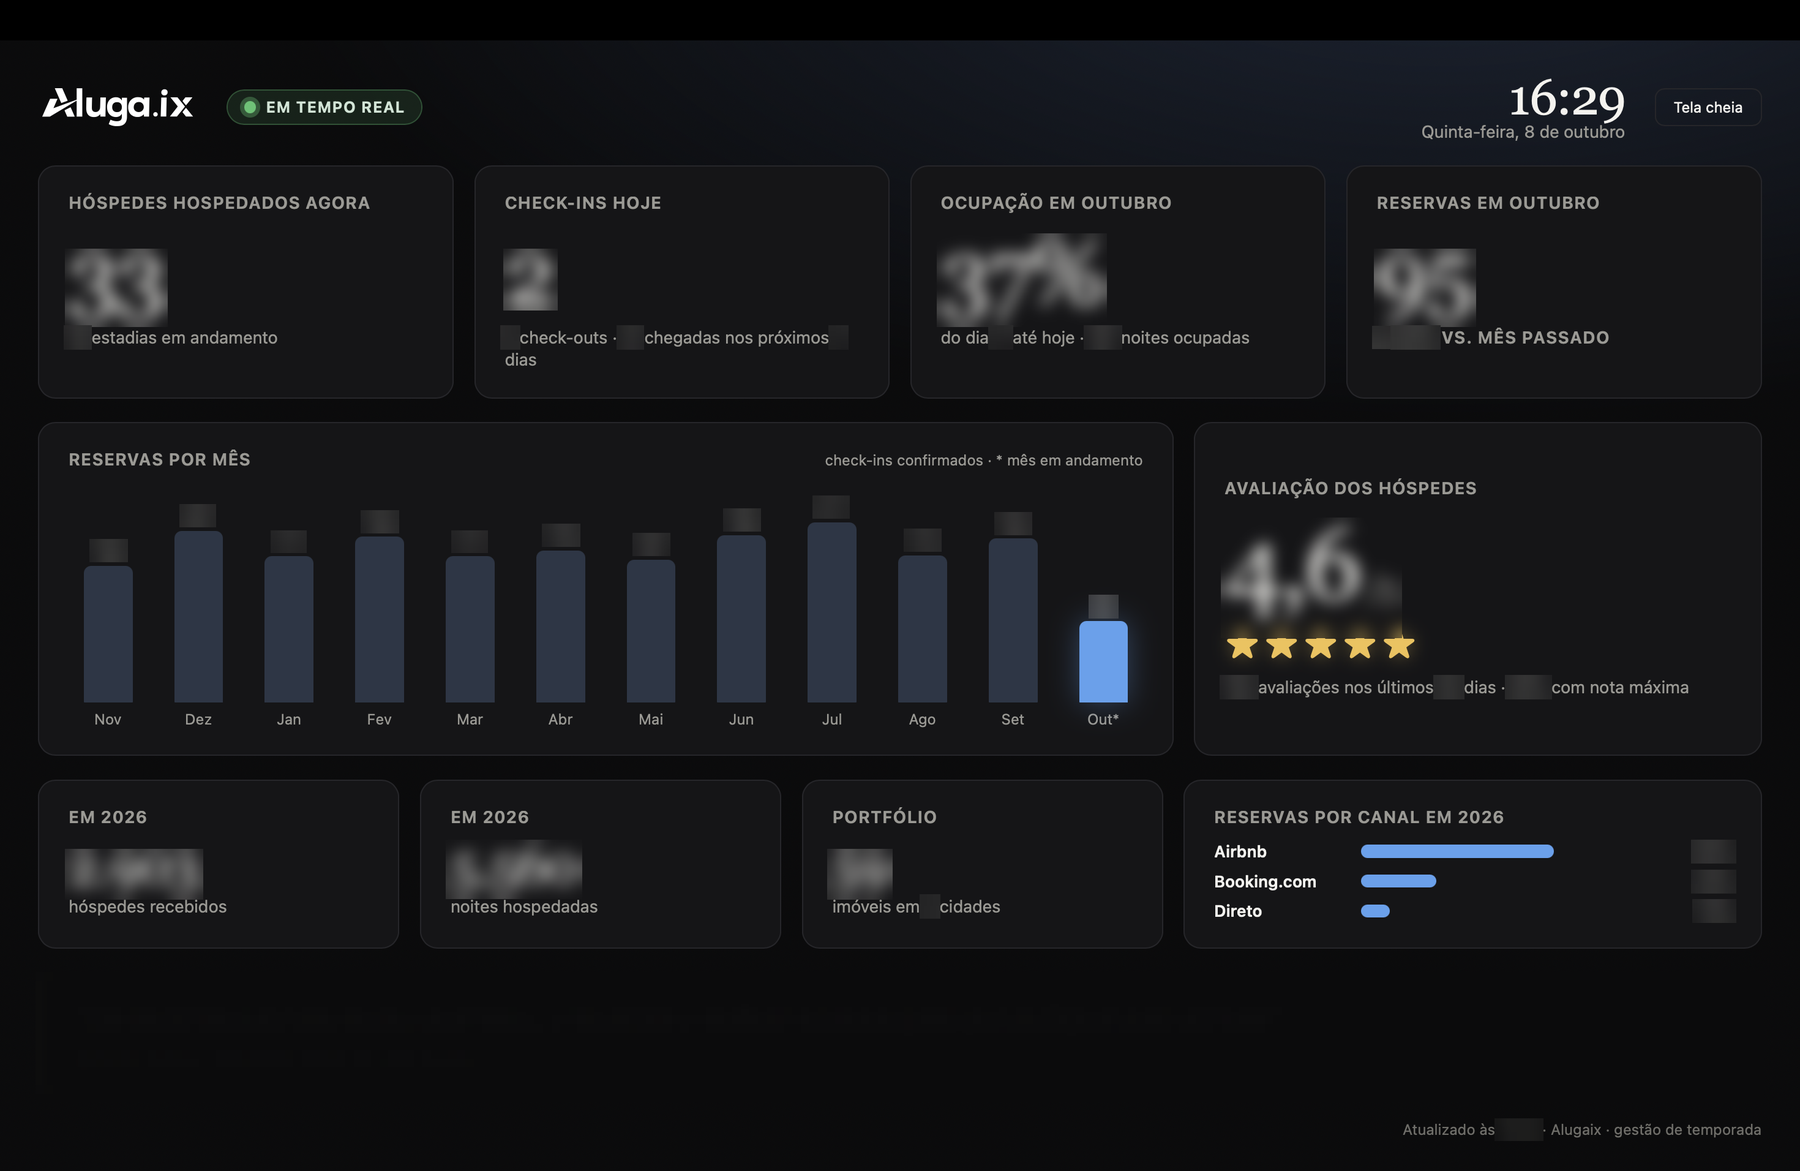
Alugaix real-time monitoring screen with current guests, today's check-ins, occupancy, monthly bookings and reviews. Values blurred.
Office screen, updated in real time: current guests, today's check-ins, occupancy, monthly bookings and guest ratings. Open image at original size
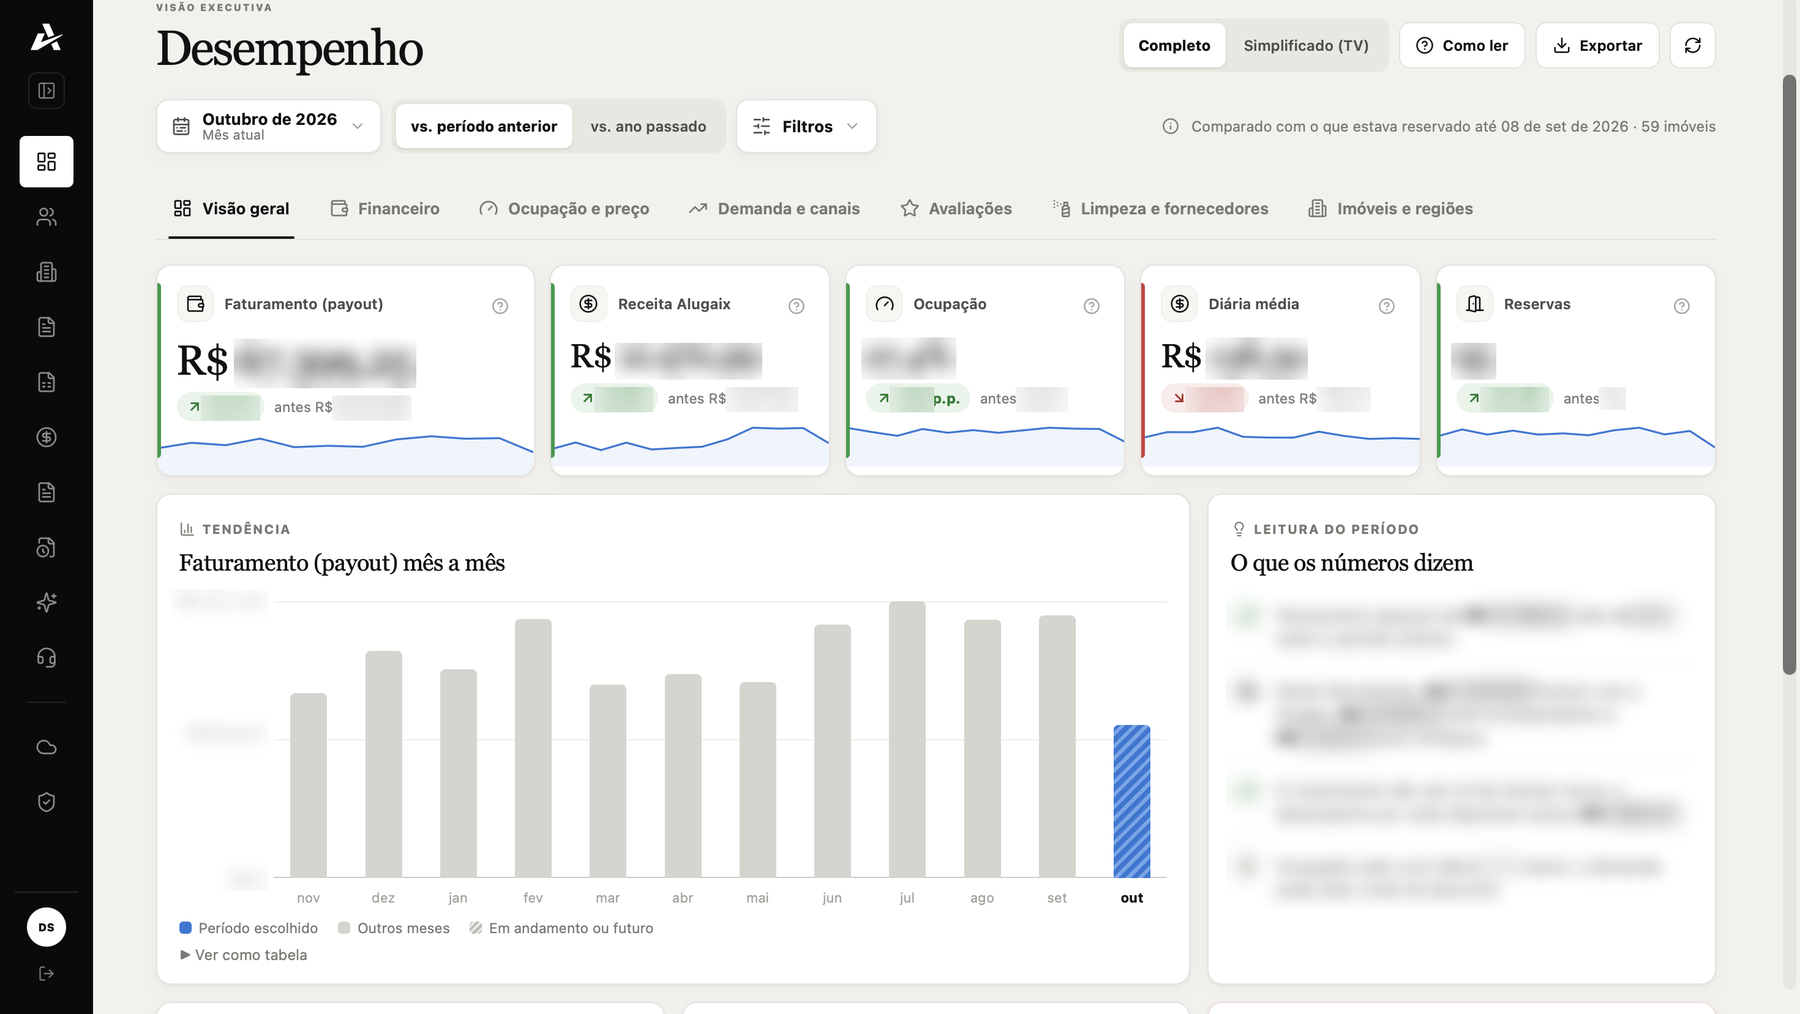
Alugaix executive dashboard with revenue, company income, occupancy, average daily rate and bookings. Values and recommendations blurred.
Executive view: revenue, Alugaix income, occupancy, average daily rate and bookings compared with the previous period, plus a summary of what the numbers indicate. Open image at original size
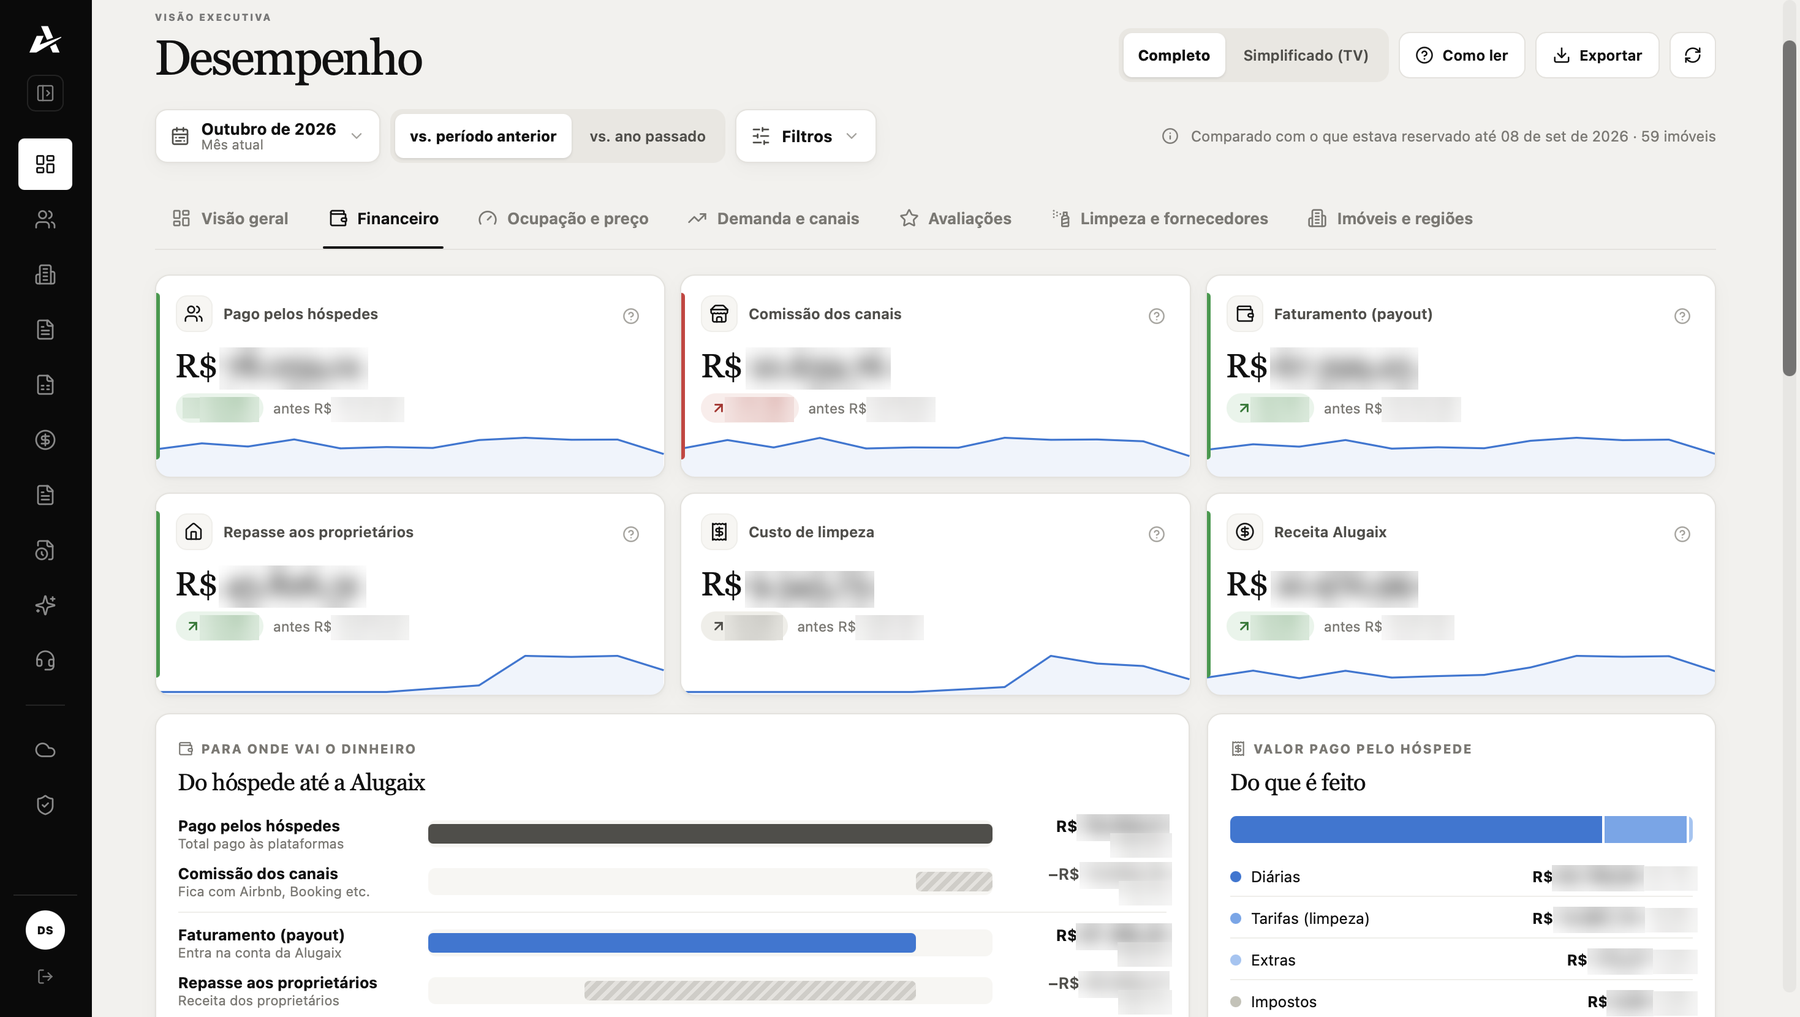
Financial tab of the Alugaix dashboard, from the amount paid by the guest to the owner payout. Values blurred.
Financial tab: the money flow, from what the guest pays to the owner payout and Alugaix income. Open image at original size
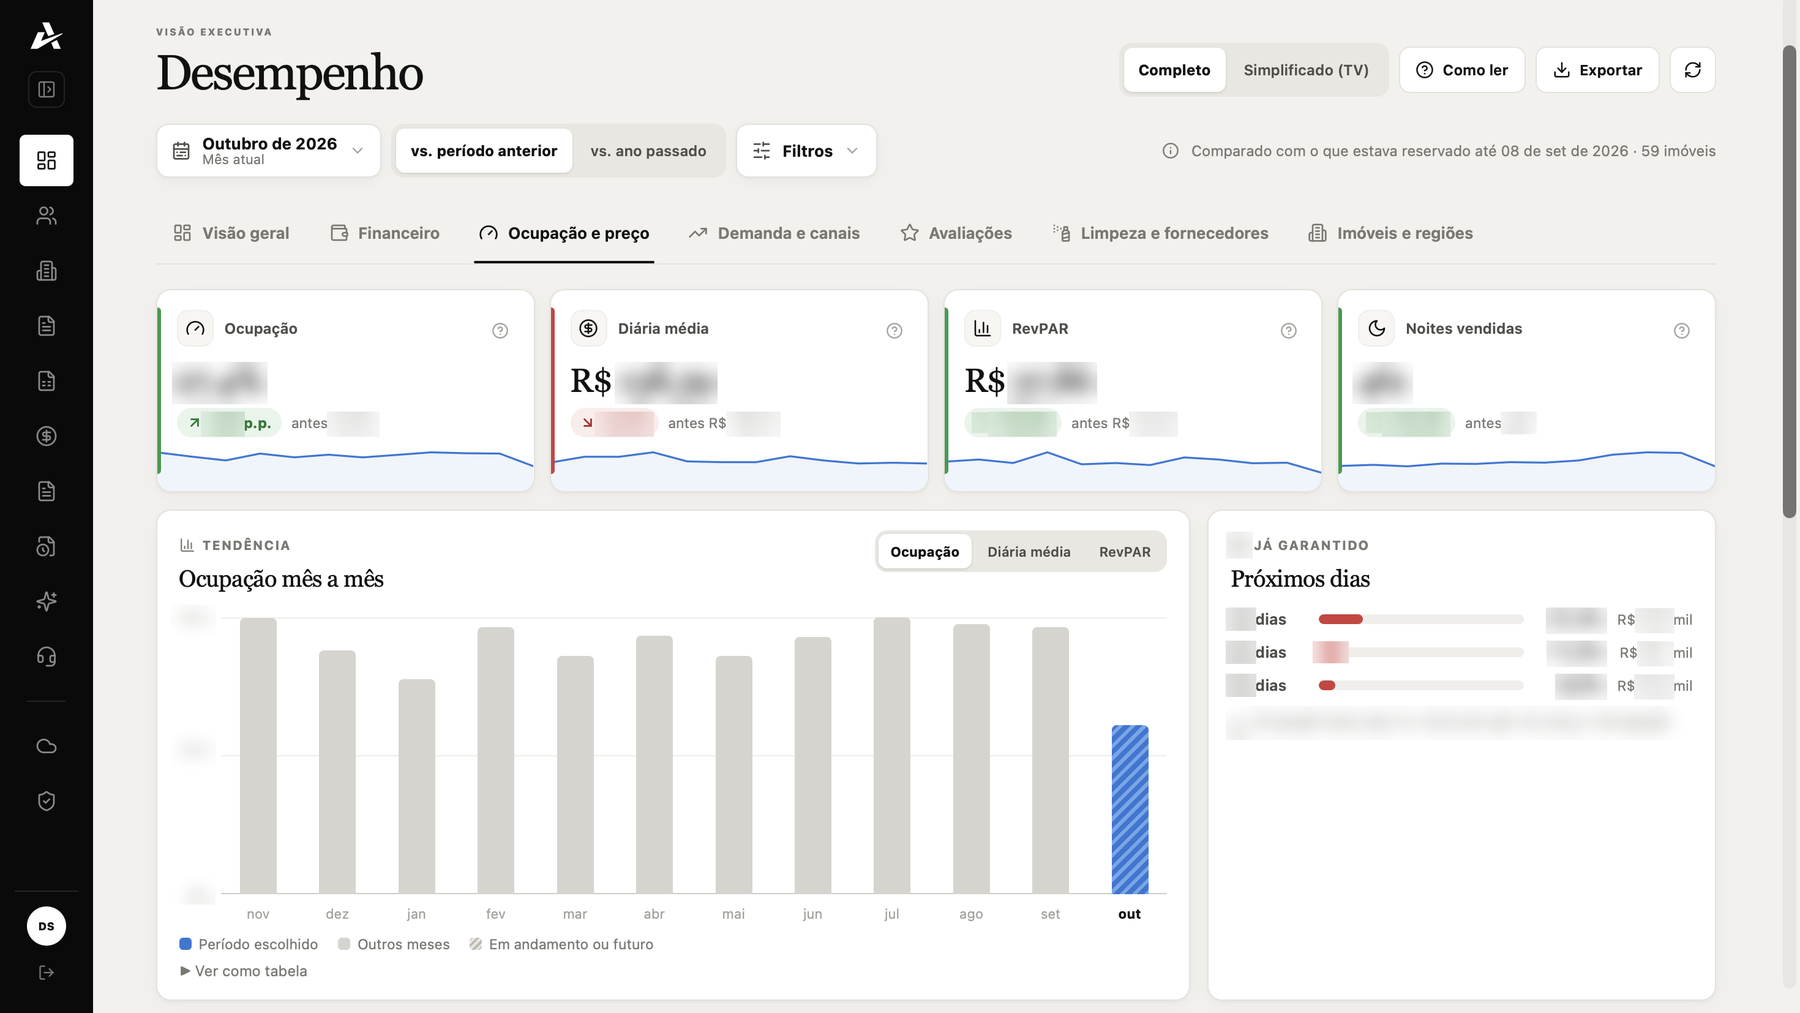
Occupancy and pricing tab of the Alugaix dashboard, with occupancy, average daily rate, RevPAR and nights sold. Values blurred.
Occupancy and pricing: occupancy, average daily rate, RevPAR, nights sold and bookings already secured for the next 30, 60 and 90 days. Open image at original size
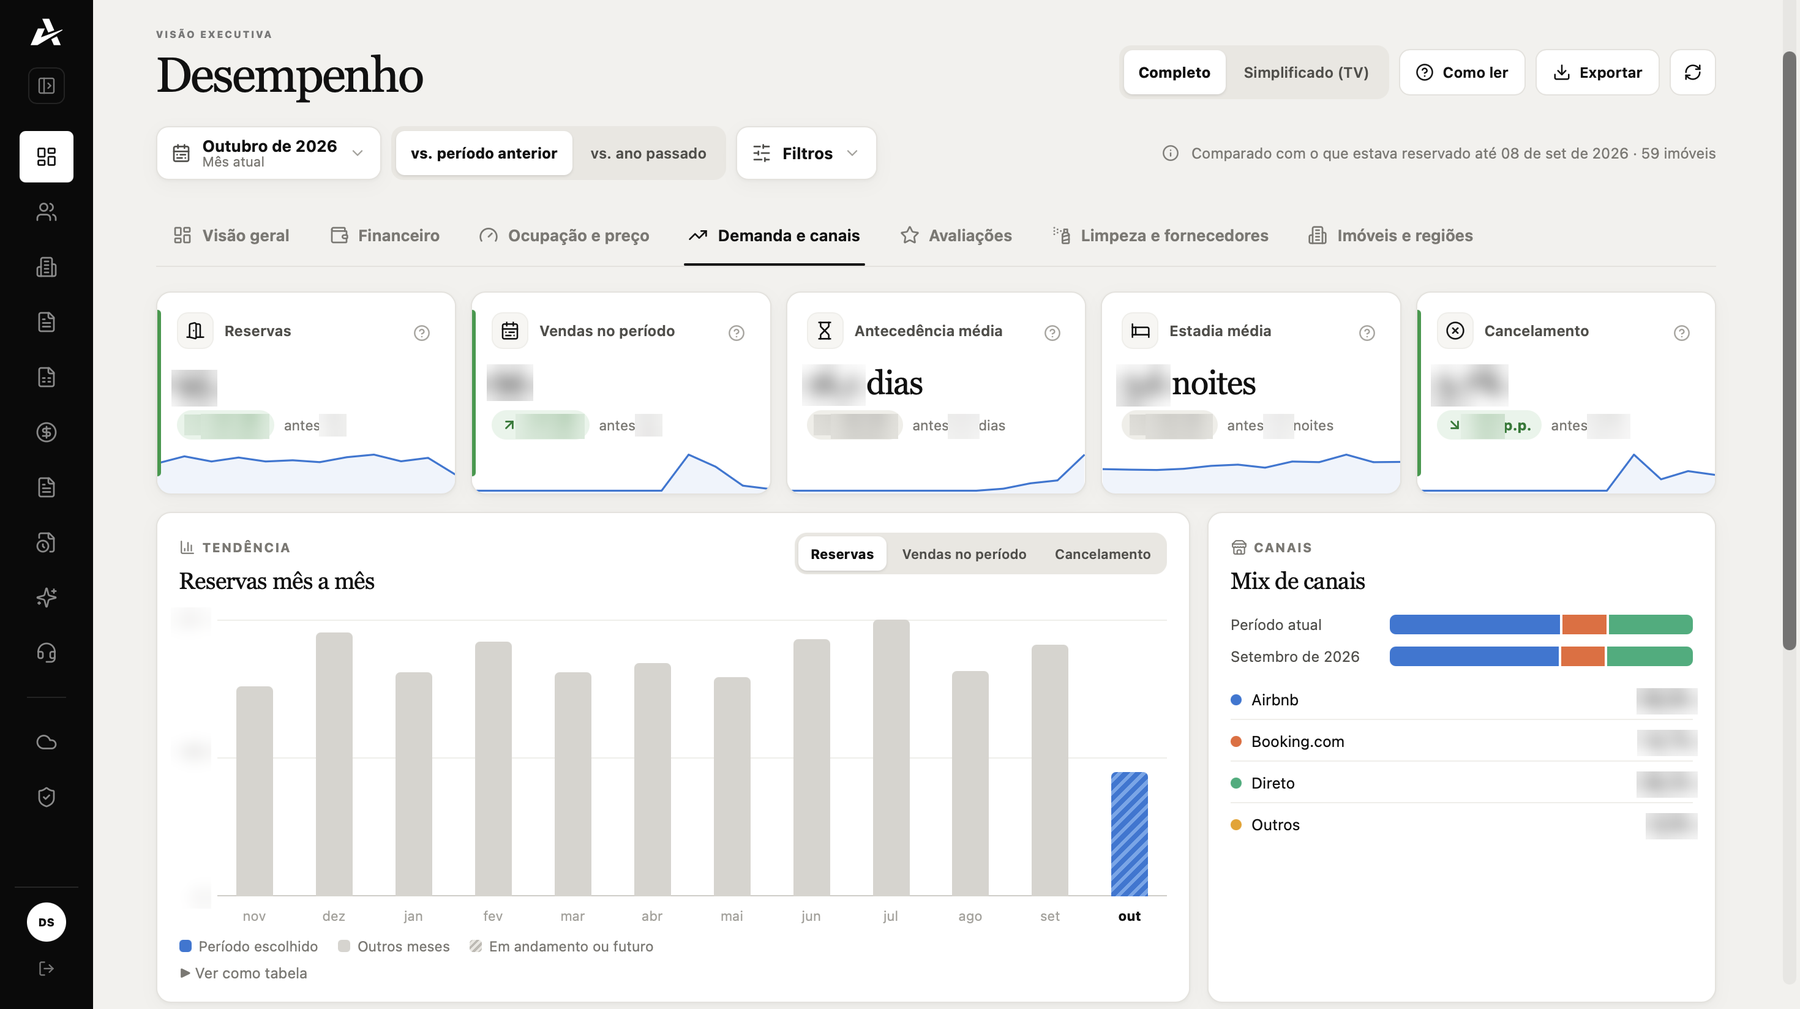
Demand and channels tab of the Alugaix dashboard, with bookings, lead time, average stay, cancellations and channel mix. Values blurred.
Demand and channels: bookings, lead time, average stay, cancellations and the share of Airbnb, Booking and direct sales. Open image at original size
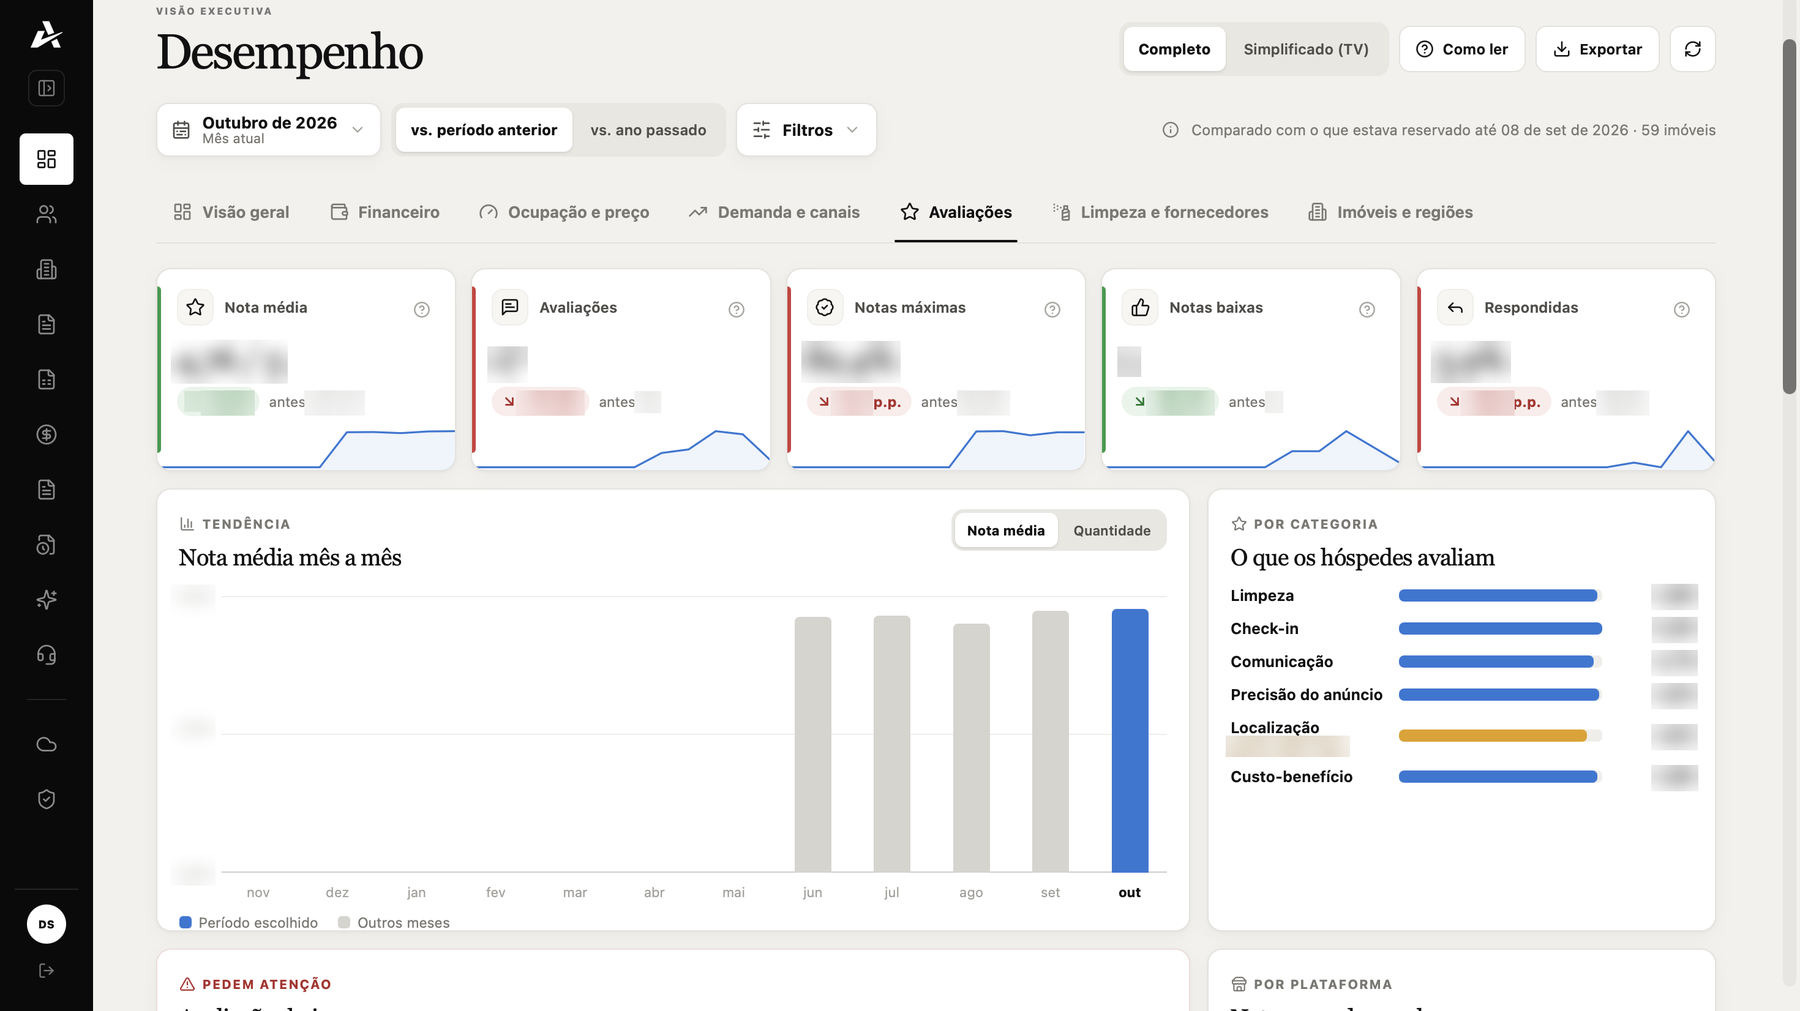
Reviews tab of the Alugaix dashboard, with average rating and ratings by category. Values blurred.
Reviews: average rating, top and low ratings, responses and what guests rate by category. Open image at original size
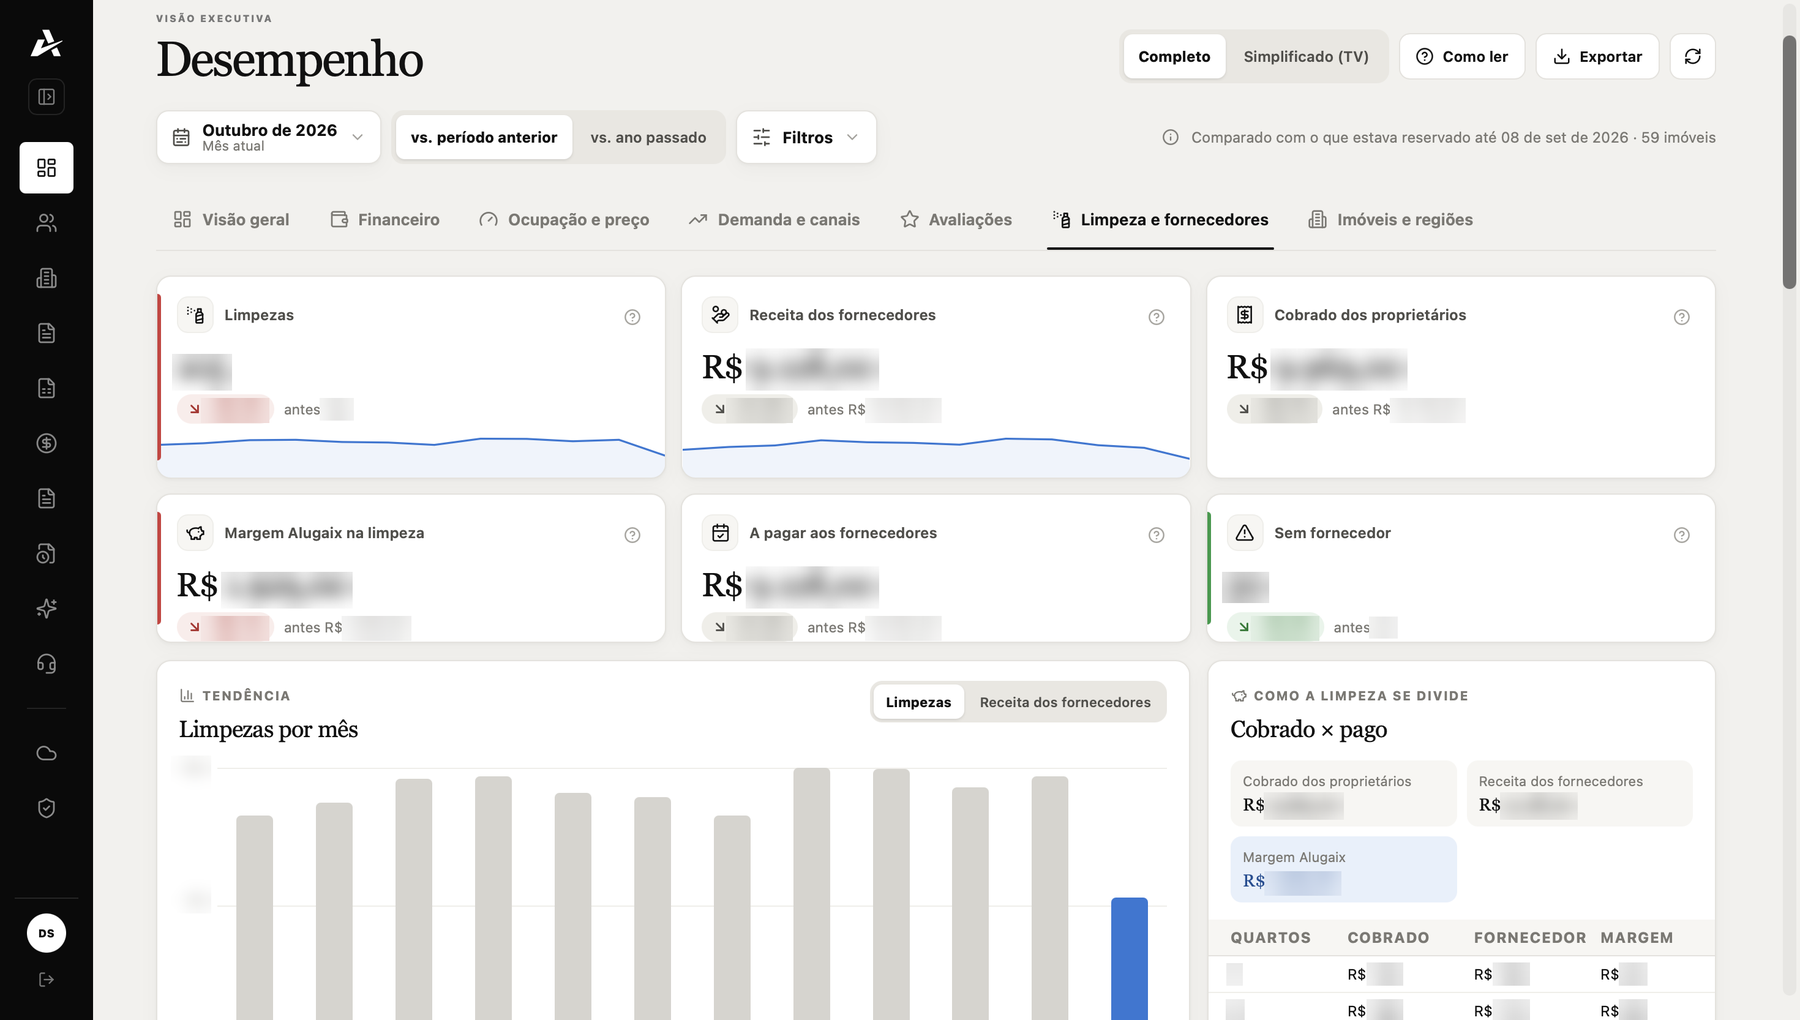
Cleaning and suppliers tab of the Alugaix dashboard, with cleanings, amounts charged and paid, and margin. Values blurred.
Cleaning and suppliers: number of cleanings, amount charged to owners, amount paid to suppliers and margin. Open image at original size
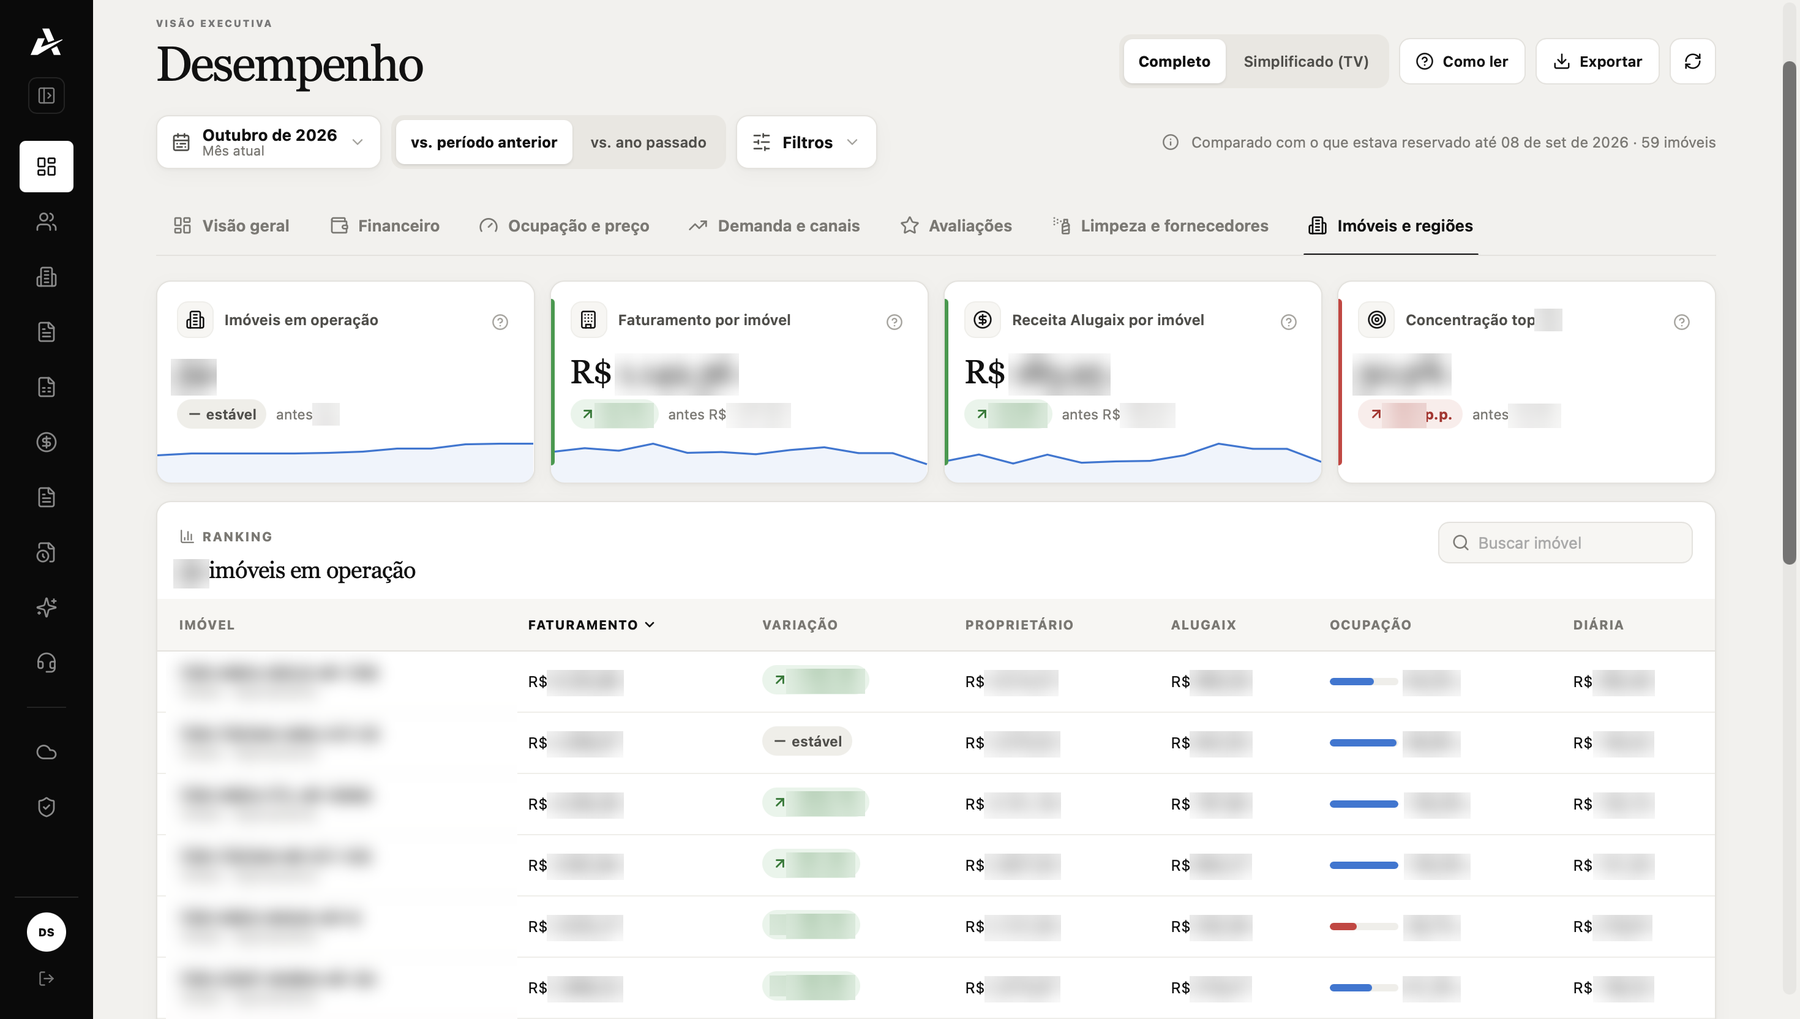
Properties and regions tab of the Alugaix dashboard, with a property ranking. Names and values blurred.
Properties and regions: property ranking by revenue, payout, occupancy and daily rate. Open image at original size
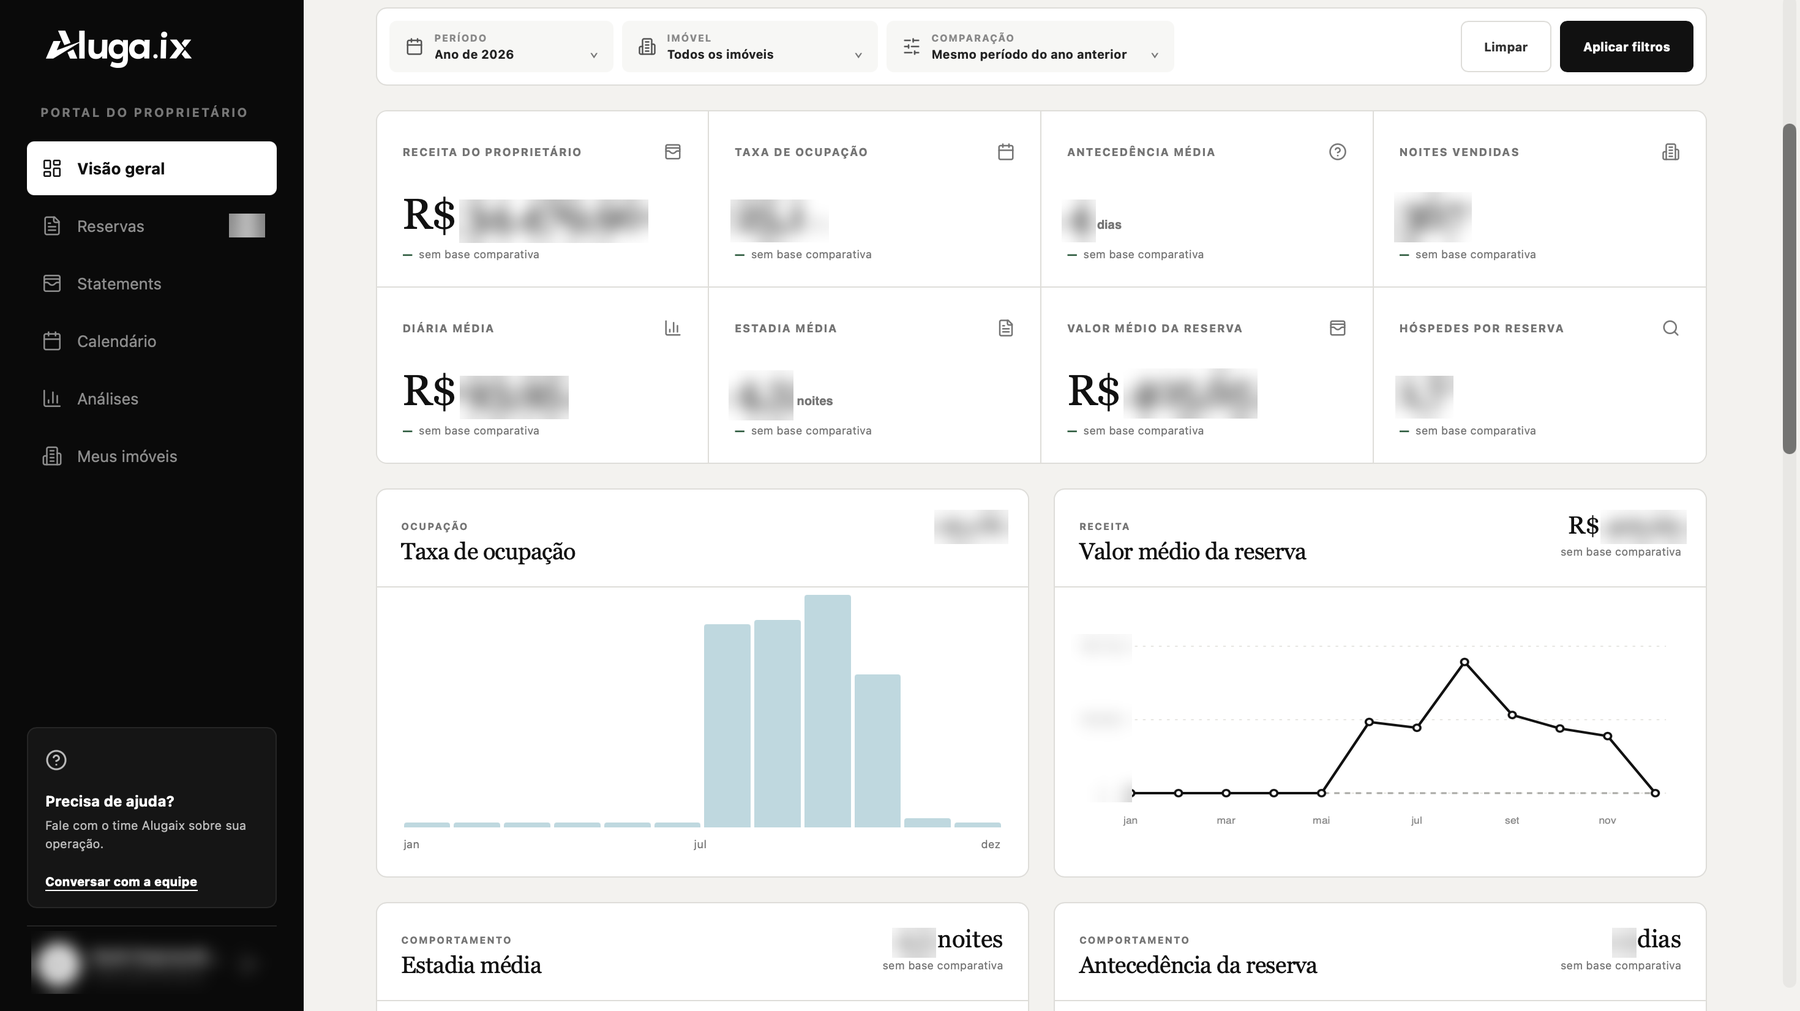
Alugaix owner portal with revenue, occupancy, average daily rate and average booking value. Values and owner name blurred.
Owner portal: revenue, occupancy, average daily rate and bookings for their own properties. Open image at original size

Values, property names, owner names and recommendations were blurred to protect client data. The dashboards are internal systems with no public access.

The result

The metrics are used in the monthly close with owners. The team follows the day's operations on the office screen, and each owner has a portal to check their own numbers.

Explore the technical details

API ingestion from Hostify, PriceLabs and sales channels; data standardization and modeling; occupancy, ADR and RevPAR metrics compared with the previous period or the same period of the previous year.

Talk about the project
Next project: Alugaix and CompactaDiscuss an opportunity

Project image